lower abv drinks, beer

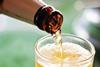
Rugby fans brought a boom to the beer market in the last quarter - with off-trade sales up 9% year on year.

Retailers stocking up ahead of the Rugby World Cup boosted beer sales to their highest-ever level in the third quarter of the year, according to figures for July to September released today by the British Beer & Pub Association. Brewers sold the equivalent of 3.7 million barrels to supermarkets and off-licences versus 3.4 million barrels in Q3 2014. 

Aggressive pricing tactics will have contributed to the boom, with exclusive research by The Grocer earlier this year showing many major brands were cheaper during the 2015 World Cup than they were during the 2011 tournament.

Echoing the steep discounting seen during the football World Cup last summer, the average price of a litre of the five biggest lager brands fell 5.7% compared with the same period four years ago [Brand View 28 September 2011 vs 28 September 2015].

In contrast to the boom in the off-trade, sale in the on-trade fell 1.2% over the period, resulting in total third-quarter beer sales up 3.9% year on year. Figures for the last 12-month period show sales were 0.4% below the previous 12 months, following what the BBPA described as “more challenging” figures in the first six months of the year.

BBPA chief executive Brigid Simmonds congratulated the brewing industry on a “very strong quarter of sales in what is one of the UK’s most vital manufactured goods”.

“There is a real opportunity to build on these strong figures and secure future growth, with continued action to reduce beer duty,” she added. “Despite duty cuts in recent years, duty still places far too great a burden on British brewers and beer drinkers when compared to our main competitors in the European Union. With further tax cuts we can create jobs and protect pubs, where beer is the cornerstone of sales.”

The Office for National Statistics last month reported the quantity of food bought in stores increased by 3.2% compared with September 2014 as shoppers responded to the high number of promotions centred on the Rugby World Cup.

UK Quarterly Beer Barometer   
3rd Quarter 2015 (July to September)          
Quarterly Beer sales (’000 barrels)          
Total sales Q1 Q2 Q3 Q4
  Volume % change Volume % change Volume % change Volume % change
1997 7,369   9,464   9,586   10,193  
1998 7,283 -1.2% 9,748 3.0% 8,892 -7.2% 9,837 -3.5%
1999 7,215 -0.9% 9,032 -7.3% 9,315 4.8% 10,265 4.3%
2000 6,852 -5.0% 9,070 0.4% 8,865 -4.8% 9,785 -4.7%
2001 6,811 -0.6% 8,972 -1.1% 8,906 0.5% 9,939 1.6%
2002 7,137 4.8% 9,305 3.7% 8,820 -1.0% 9,879 -0.6%
2003 7,048 -1.2% 9,286 -0.2% 9,270 5.1% 9,896 0.2%
2004 7,318 3.8% 9,485 2.1% 8,795 -5.1% 10,043 1.5%
2005 7,090 -3.1% 9,087 -4.2% 8,995 2.3% 9,730 -3.1%
2006 6,966 -1.8% 9,500 4.6% 8,399 -6.6% 9,582 -1.5%
2007 6,783 -2.6% 8,835 -7.0% 8,357 -0.5% 9,180 -4.2%
2008 6,773 -0.2% 8,481 -4.0% 7,780 -6.9% 8,448 -8.0%
2009 6,252 -7.7% 8,063 -4.9% 7,740 -0.5% 8,159 -3.4%
2010 5,965 -4.6% 8,361 3.7% 7,029 -9.2% 7,795 -4.5%
2011 5,818 -2.5% 7,630 -8.7% 7,248 3.1% 7,781 -0.2%
2012 5,747 -1.2% 7,204 -5.6% 6,813 -6.0% 7,268 -6.6%
2013 5,587 -2.8% 6,863 -4.7% 7,180 5.4% 7,368 1.4%
2014 5,481 -1.9% 7,505 9.4% 6,908 -3.8% 7,444 1.0%
2015 5,435 -0.8% 7,086 -5.6% 7,175 3.9%    
                 
On-trade sales Q1 Q2 Q3 Q4
  Volume % change Volume % change Volume % change Volume % change
1997 5,790   6,745   6,746   6,884  
1998 5,656 -2.3% 6,629 -1.7% 6,366 -5.6% 6,606 -4.0%
1999 5,469 -3.3% 6,359 -4.1% 6,317 -0.8% 6,360 -3.7%
2000 5,246 -4.1% 6,096 -4.1% 5,969 -5.5% 6,047 -4.9%
2001 5,022 -4.3% 5,923 -2.8% 5,802 -2.8% 6,016 -0.5%
2002 5,069 0.9% 5,838 -1.4% 5,629 -3.0% 5,797 -3.6%
2003 4,901 -3.3% 5,685 -2.6% 5,597 -0.6% 5,706 -1.6%
2004 4,833 -1.4% 5,660 -0.4% 5,422 -3.1% 5,599 -1.9%
2005 4,701 -2.7% 5,343 -5.6% 5,293 -2.4% 5,393 -3.7%
2006 4,470 -4.9% 5,310 -0.6% 4,972 -6.1% 5,190 -3.8%
2007 4,298 -3.8% 4,963 -6.5% 4,716 -5.2% 4,761 -8.3%
2008 3,950 -8.1% 4,449 -10.3% 4,346 -7.8% 4,302 -9.6%
2009 3,720 -5.8% 4,266 -4.1% 4,162 -4.2% 4,108 -4.5%
2010 3,415 -8.2% 4,028 -5.6% 3,878 -6.8% 3,813 -7.2%
2011 3,355 -1.8% 3,933 -2.4% 3,792 -2.2% 3,844 0.8%
2012 3,190 -4.9% 3,745 -4.8% 3,596 -5.2% 3,635 -5.5%
2013 3,021 -5.3% 3,521 -6.0% 3,560 -1.0% 3,588 -1.3%
2014 2,930 -3.0% 3,599 2.2% 3,493 -1.9% 3,515 -2.0%
2015 2,853 -2.6% 3,422 -4.9% 3,452 -1.2%    
                 
Off-trade sales Q1 Q2 Q3 Q4
  Volume % change Volume % change Volume % change Volume % change
1997 1,578   2,719   2,839   3,309  
1998 1,627 3.1% 3,119 14.7% 2,526 -11.0% 3,231 -2.3%
1999 1,745 7.3% 2,673 -14.3% 2,999 18.7% 3,905 20.8%
2000 1,607 -7.9% 2,975 11.3% 2,895 -3.4% 3,738 -4.3%
2001 1,789 11.4% 3,048 2.5% 3,103 7.2% 3,923 4.9%
2002 2,067 15.6% 3,468 13.8% 3,191 2.8% 4,082 4.0%
2003 2,147 3.8% 3,601 3.8% 3,673 15.1% 4,190 2.7%
2004 2,486 15.8% 3,825 6.2% 3,373 -8.2% 4,444 6.1%
2005 2,390 -3.9% 3,744 -2.1% 3,702 9.7% 4,338 -2.4%
2006 2,496 4.4% 4,191 11.9% 3,427 -7.4% 4,392 1.3%
2007 2,485 -0.4% 3,872 -7.6% 3,642 6.3% 4,419 0.6%
2008 2,823 13.6% 4,031 4.1% 3,435 -5.7% 4,146 -6.2%
2009 2,531 -10.3% 3,797 -5.8% 3,578 4.2% 4,052 -2.3%
2010 2,550 0.7% 4,333 14.1% 3,151 -11.9% 3,982 -1.7%
2011 2,463 -3.4% 3,697 -14.7% 3,456 9.7% 3,936 -1.2%
2012 2,557 3.8% 3,459 -6.4% 3,216 -6.9% 3,633 -7.7%
2013 2,566 0.3% 3,342 -3.4% 3,620 12.5% 3,781 4.1%
2014 2,550 -0.6% 3,906 16.9% 3,415 -5.6% 3,930 3.9%
2015 2,581 1.2% 3,664 -6.2% 3,724 9.0%