


Fmcg needs advertising and advertising needs fmcg. Without one, where would the other be? Fmcg is by far the biggest advertising sector in the world. Its figures are impressive.
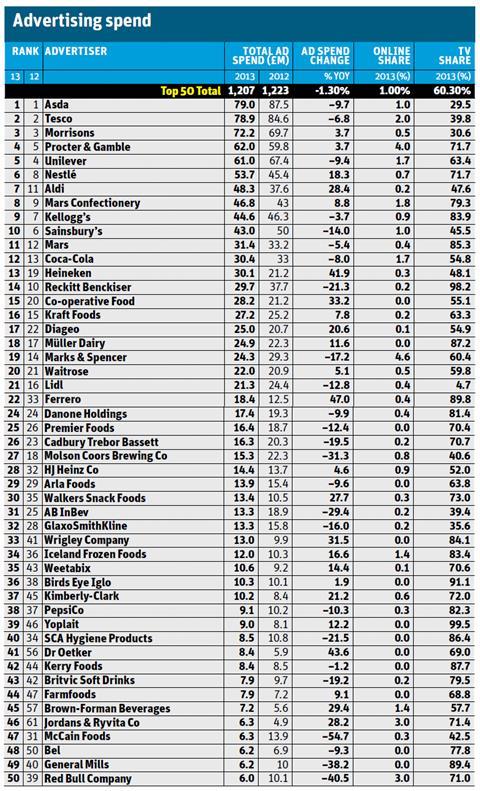
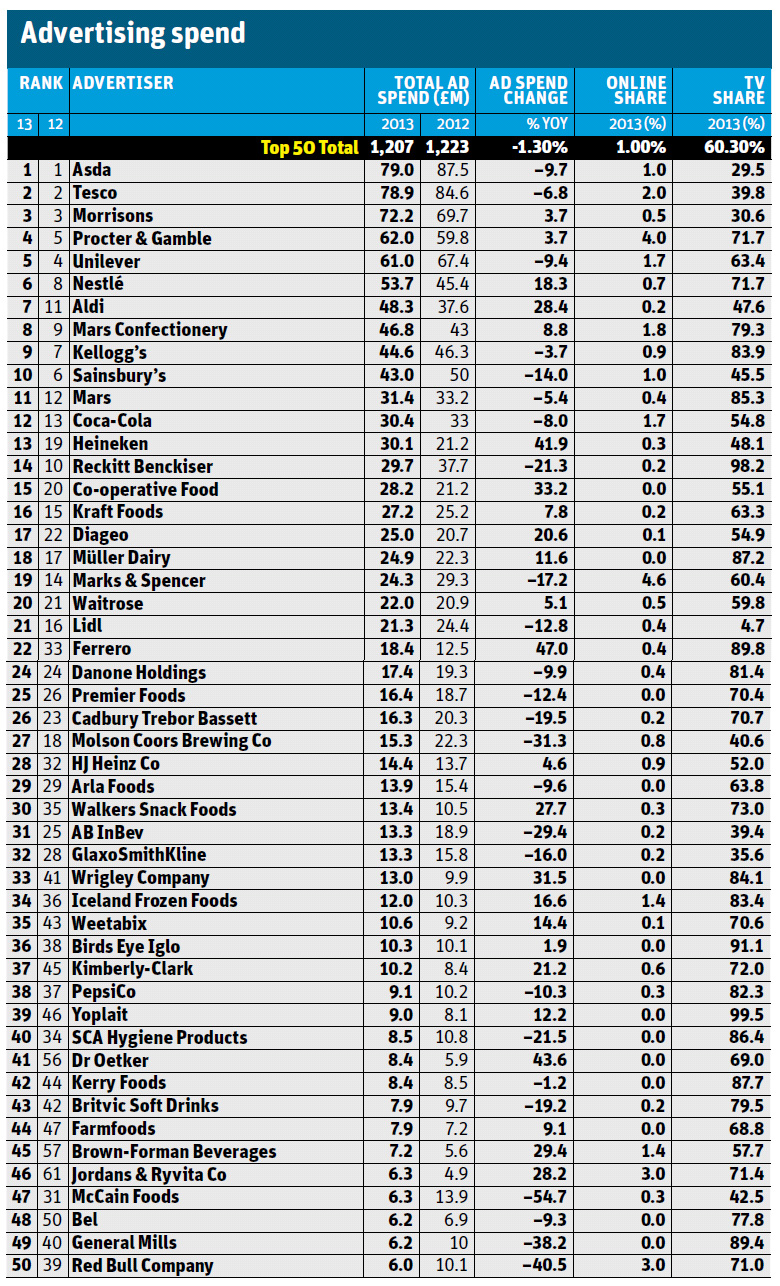
See the full table of advertising spend in 2013.
In the first half of this year, it accounted for 21.3% of the world’s media spend, dwarfing entertainment (13%), industry & services (11.3%) and automotive (9.2%) - the next biggest sectors. Its share is also on the rise, nudging up from 20.5% for the corresponding period last year. This is reflected in the amount individual food and drink players have invested over the past year.
“Millennials like dynamic stimuli and bright colours, have good memory and are good at multi-sensory processing”
But break things down and the picture is more varied. Over recent years, Europe has stubbornly remained the one global region collectively dogged by cuts in ad spend. Marketers and their agencies are being asked to do more with less.
And the media landscape is getting more complex, as the multi-channel nature of The Grocer’s pick of this year’s top campaigns demonstrates. Consumers are consuming content across many different platforms - shows that used to be available only on TV are now often watched online. So, how should brands allocate their ad spend between TV and online?
Read this: The Grocer’s Top Campaigns of 2015.
At Nielsen, we analyse the effectiveness of advertising allowing us to provide marketers with insights into the reach, resonance and reaction of their campaigns - in other words, who saw their ad, how they felt about it, and what the resulting sales effect was.
As part of this process, every year, we analyse the performance of thousands of new TV ads, measuring criteria such as how well people can recall them, and what their purchase intent is. Here are four tips we have learned from our years of analysis to help you increase the effectiveness of your marketing investment:
1. Post recession, keep calm and carry on: Entertain and connect first, educate second. UK shoppers are aware of, and coming to terms with, the new post-recession reality you don’t have to remind them of it. Based on an analysis of some 200,000 ads, we know that advertising resonates best with its audience (by 24% above average) when it is entertaining rather than product-focused. Aldi ads, for example, are consistent top performers in this area.
2. Think people, not robots: Rethink ‘reach’. We know that fewer than 50% of all online ad impressions reach their intended audience. Find out who is seeing your ad by age and gender, rather than relying on robot impressions figures. Impression fraud is estimated to cost at least £1.85bn per year.
3. Macro matters: Some 10% of ad spend in the UK is on food advertising, more than double that for clothing. Food as a sub-sector is saturated, hard to cut through and shows diminished effectiveness. We can see this effect in categories like Greek yoghurt, which has gone from having one main competitor to five in the past two years. We observed a systematic decline in ad effectiveness across all brands, as new brands entering the market.
4. Inspire the millennials: Generation Y are your new hope inspire them. Our consumer neuroscience service Nielsen NeuroFocus tested millennials’ response to online advertising using electroencephalography. It found that they like dynamic stimuli and bright colours, have good memory and are good at multi-sensory processing. When communicating with them, use offbeat, extreme, relatable, intense, sarcastic and aspirational content. Forget about soft, safe music, or anything too detailed or static.
So, put consumers at the centre of the planning process and make your ad spend work harder for you. You can contact us at Nielsen to see results and insights for your brand and category.
Read this: The Grocer’s Top Campaigns of 2015.
See The Grocer’s full Top Products Survey.
Nielsen advertising expenditure methodology
Internet advertising
Internet spend includes all internet advertising, but does not include keyword search, social media or mobile. Impressions data is captured from more than 1000 of the UK’s most popular sites, based on site nomination and Nielsen audience traffic. A cost-per-thousand (CPT) rate card has been devised with sites, enabling advertiser activity to be placed into number-of-impressions bandings. Other sites are calculated using a standard CPT. Research is also gathered from industry sources (IAB & WARC) for weighting adjustments to final totals. All banner sizes are measured including buttons, skyscrapers, 468x60 standard banners and pop-ups.
TV advertising
Programme information and ratings data are matched to ads. Costs are applied based on demographics and costs derived from monthly station revenues. Cost estimates are then broken down and applied to each individual spot with weightings applied for spot length and time of day.


No comments yet