Close menu
- Home
- Retail & Wholesale
-
Products & Suppliers
- Back to parent navigation item
- Products & Suppliers
-
Product Categories:
- Back to parent navigation item
- Product Categories:
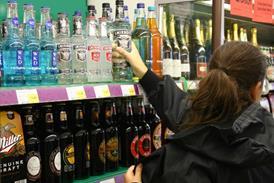
- Alcoholic drinks
- Bakery
- Cereals & breakfast
- Cheese
- Chicken & poultry
- Chocolate
- Confectionery
- Crisps, nuts & snacks
- Dairy
- Fish
- Fresh produce
- Frozen
- Household
- Meat
- Own Label
- Sauces & condiments
- Seasonal
- Soft drinks
- Vaping
- Vegan & plant-based
- World foods
- Suppliers
- People
- Reports & Data
-
Topics A-Z
- Back to parent navigation item
- Topics A-Z
-
Popular topics:
- Back to parent navigation item
- Popular topics:
- Cost of living crisis
- Crime
- Deposit Return Schemes
- Finance
- Government & Regulation
- Health
- Inflation
- Loyalty
- Marketing
- Mergers & Acquisitions
- New Product Development
- Sourcing
- Supply chain
- Sustainability & environment
- Technology
- Ultra Processed Foods
- Vaping
- A-Z all topics
- Content by type:
- Events
- Ask iA (beta)
- Subscribe now


- Previous slide
- 1 of 1
- Next slide
| Halloween value sales | |||
|---|---|---|---|
| Category | Value (m) | %yoy | |
| Total Halloween | 117 | 2.4 | |
| Chocolate | 67 | 2.9 | |
| Sweets | 27 | 2.5 | |
| Cakes | 16 | 2.3 | |
| Pumpkins | 5 | -5.3 | |
| Source: Kantar Worldpanel, 4 weeks to 5 November 2017 | |||
Halloween can be a powerful driver of both footfall and spend. Last year, Britain forked out £117m on food and drink at the supermarkets in the four weeks to Halloween. That’s 2.4% more than the four-week average for the rest of the year, excluding Christmas.
Spend on chocolate, sweets and cakes continues to grow. That’s not just down to trick or treaters; Brits are also treating themselves at events such as scary films.
Despite the dip in pumpkin sales, shopping missions for specific food and drink items saw a 9.5% rise in the last full week before the event, suggesting Halloween-specific produce can be a big lure for shoppers.
Indeed, Morrisons, which ran in-store pumpkin carving sessions and deep-cut deals, saw the greatest share of what Kantar terms ‘specific journeys’ relative to its size during the witching season [4 w/e 5 November 2017].
But getting punters through the door is only part of the challenge. Morrisons also saw spend dip 1.2% (although pumpkin sales were up 10%), due to falling basket size, while the rest of the big four grew.
Big investment on festive ads and deals, such as two for £7 promotions on chocolate tubs, helped Tesco deliver the greatest big four increase, of 5.9%. Asda, which already has the greatest share of Halloween relative to its size, also yielded a 0.9% increase in spend.
The biggest winner in percentage terms was Aldi, up 16.9%, though its share of Halloween spend is still two percentage points less than its share of grocery.