


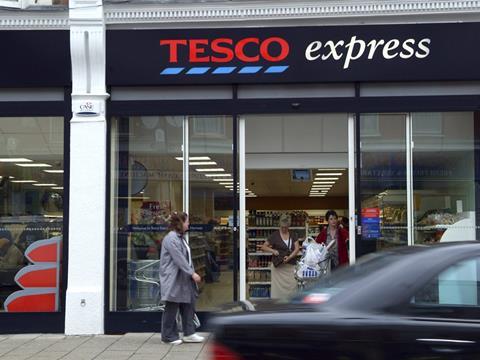
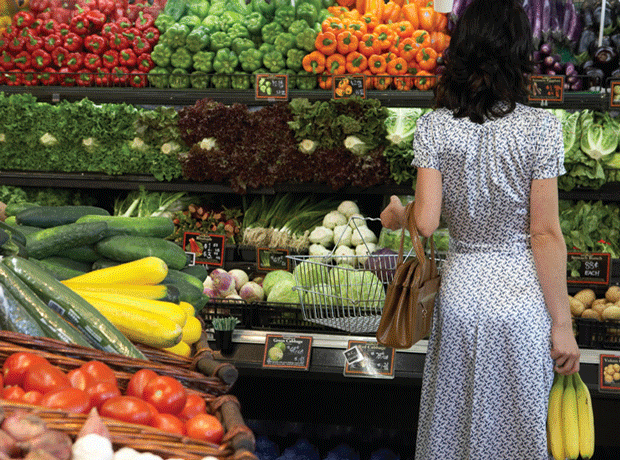
Tesco recorded a 4% tumble in sales in the 12 weeks to 17 August, according to the latest market figures from Kantar Worldpanel.
The retailer’s share of the market fell to 28.2% compared to 30.2% a year ago.
Tesco’s sales fall was the largest of the big four; Morrisons likewise recorded sales down 1.9%, with its share slipping to 11%.
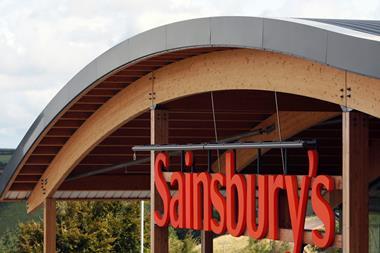
Sainsbury’s recorded sales growth of 0.3%, and a slight dip in share to 16.4%.
Asda ’s competitive pricing strategy appeared to pay off in the 12-week period, as it notched up 1.2% sales growth and fractionally grew its share to 17.2%.
Waitrose, meanwhile, chalked up 3.6% growth, increasing its share to 4.9%.
“Asda and Waitrose have achieved growth with differing strategies,” said Kantar Worldpanel director Edward Garner. “Asda has pushed its ‘Price Lock’ strategy to keep prices on everyday essential items low, while Waitrose is running competitive offers on home delivery alongside offers for myWaitrose card users allied to its overall quality and provenance positioning.”
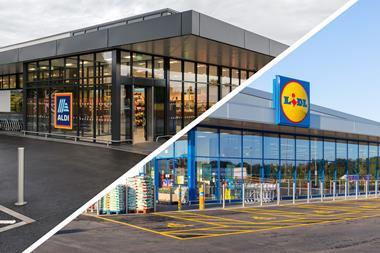
Aldi’s share of the market remained at 4.8%, despite speculation it might overtake Waitrose this month, with sales up 29.5%.
Lidl also held its share at 3.6%, growing sales by 18.3%. Both German discounters saw a slight slowdown in sales growth compared to last month’s figures.
Elsewhere, Iceland recorded another 0.3% sales dip, with its share steady at 2%. And Farmfoods’ sales climbed 8.3% to help it maintain a 0.7% hold on the market.
Growth in the overall grocery market slumped to a 10-year low of 0.8%, as the supermarket price war and aggressive pricing by the discounters pegged back sales.
“Competitive pricing among the big grocers and deflation in the price of staple items such as vegetables, milk and bread has driven inflation down yet again,” said Garner. “This naturally impacts on the overall growth of the grocery market.”
Grocery inflation stood at 0.2% for the 12-week period, a record low since Kantar Worldpanel began recording it in October 2006.
| Total Till Roll - GB Consumer Spend | |||||
|---|---|---|---|---|---|
| 12 weeks to 18 August 2013 | 12 Weeks to 17 August 2014 | % Change | |||
| £000s | % ** | £000s | % ** | % | |
| Total Till Roll | 31,726,280 | 32,074,650 | 1.1% | ||
| Total Grocers | 24,530,620 | 100.0% | 24,738,980 | 100.0% | 0.8% |
| Total Multiples | 24,014,970 | 97.9% | 24,228,360 | 97.9% | 0.9% |
| Tesco | 7,419,795 | 30.2% | 7,122,376 | 28.8% | -4.0% |
| Asda | 4,206,443 | 17.1% | 4,256,458 | 17.2% | 1.2% |
| Sainsbury’s | 4,048,946 | 16.5% | 4,060,492 | 16.4% | 0.3% |
| Morrisons | 2,769,848 | 11.3% | 2,717,873 | 11.0% | -1.9% |
| The Co-operative | 1,607,929 | 6.6% | 1,589,389 | 6.4% | -1.2% |
| Waitrose | 1,176,703 | 4.8% | 1,218,595 | 4.9% | 3.6% |
| Aldi | 916,541 | 3.7% | 1,187,340 | 4.8% | 29.5% |
| Lidl | 757,955 | 3.1% | 896,393 | 3.6% | 18.3% |
| Iceland | 486,821 | 2.0% | 485,196 | 2.0% | -0.3% |
| Farmfoods | 162,536 | 0.7% | 176,013 | 0.7% | 8.3% |
| Other Multiples | 461,448 | 1.9% | 518,235 | 2.1% | 12.3% |
| Symbols & Independents | 515,655 | 2.1% | 510,626 | 2.1% | -1.0% |
** = Percentage Share of Total Grocers


No comments yet