

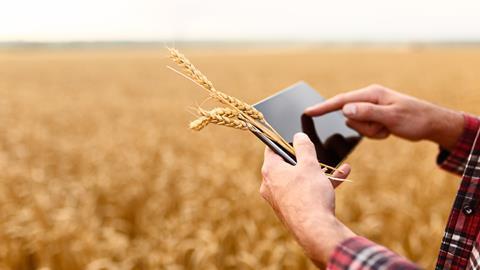

With the climate crisis cited as ‘the greatest challenge of our generation’, cutting emissions of potent greenhouse gases (GHGs) is serious business. Here, Map of Ag shows how it has been using high-resolution data from farms to help cut scope 3 GHGs.
There’s nothing funny about nitrous oxide (aka laughing gas) or methane-rich cow burps. Both result from biological processes that are key to food production (and digestion) and both are potent greenhouse gases. Cutting emissions of both is therefore a serious business.
“The climate crisis is the greatest challenge of our generation,” said Morrisons CEO David Potts in October 2021 on announcing a raft of new climate pledges, including making the retailer’s operations net zero by 2035 and cutting own brand supply chain emissions by 30% by 2030. “As a supermarket we depend on a healthy planet to produce the goods we sell.”
A healthy planet, in turn, largely depends on drastic greenhouse gas emission reductions. That’s not just carbon dioxide, which tends to get most attention. Molecule for molecule, methane is at least 28 times as good at trapping heat and warming the planet; nitrous oxide is about 273 times as potent. That’s where the cow burps and laughing gas come in.
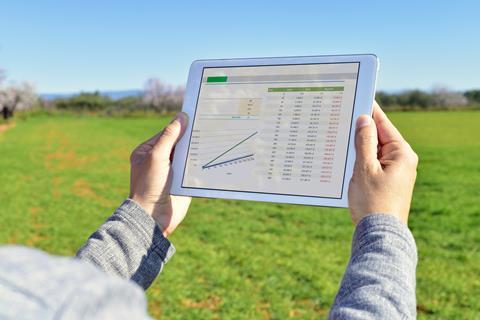
Tapping into high-resolution data
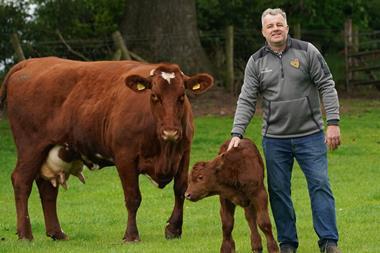
“Livestock such as cows and sheep belch a lot of methane and many crops are responsible for a large share of the emissions of nitrous oxide through the use of organic and inorganic nitrogen fertilisers,” says Hugh Martineau, head of sustainability at farm analytics specialist Map of Ag, which has been working with Morrisons to calculate its suppliers’ emissions since 2020.
“To make climate commitments stack up you first need an accurate understanding of farm emissions to develop a specific baseline against which you can measure progress. The key determining factor is how farm resources are used; animals, production areaon a farm, and the inputs (food or fertilisers) they require to generate output (milk, meat or produce). But there are many variables influencing the production processes.”
Such calculations can’t be based on averages. “A standard figure from an emissions factor database is too black and white,” adds Martineau. “There are always shades of grey. There are many variables on farms that influence emissions from production. You need high-resolution data to understand the baseline and identify opportunities to reduce emissions.”
Mapping farm inputs and outputs
Of course, Martineau and his colleagues aren’t required to count cows (or their burps) or measure production area to find out what’s happening down on the farm. Map of Ag connects data relating to farm inputs and outputs and to populate emissions calculation models. This is done by accessing existing data sources which can reduce the time and effort for farmers and significantly increase the accuracy and consistency of results.
“A good example of this is how, with farmers’ permission, we are accessing British Cattle Movement Scheme (BCMS) data to develop an understanding of the emissions of beef and dairy producers, which are responsible for a significant proportion of the food industry’s greenhouse gas emissions,” says Martineau.
“You can get a very good understanding of an emissions profile by looking at a producer’s livestock inventory through the BCMS. This gives you a single source of truth with a very low administrative burden on the farmers. We then use data from other sources such as farm management software to provide other elements of the activity data required. In combination these data generate insights and inform the baseline position and how to reduce emissions.”
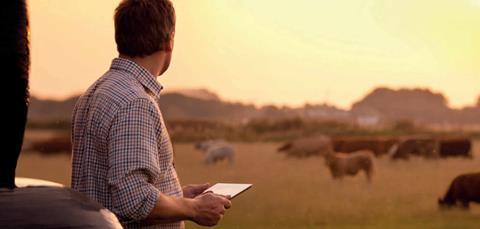
Measuring methane
“Beef and dairy account for 47% of overall national emissions from agriculture and a further 15% from manure management,” says Martineau. “That illustrates the importance of those emissions. We are not here to tell farmers what to do. We want to ensure they have the right data so they can make the best use of their land without harming the environment.”
By using accurate information relating to the farming operation, we can then identify the areas of opportunity for emissions reduction. There are often opportunities to improve efficiency of production which will reduce emissions and improve profitability. Through the calculations we provide efficiency indicators alongside the emissions calculations such as feed conversion efficiency and herd fertility - areas that farmers can focus on to improve the emissions intensity and improve profitability – it’s a win-win.
Nitrous oxide: not a laughing matter
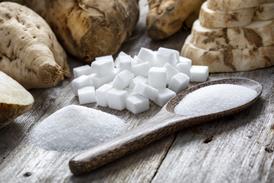
The same applies to nitrous oxide. Not only is it particularly good at absorbing heat, it also stays in the atmosphere for an average of 114 years before disintegrating (methane disintegrates after around 12). “Nitrogen needs a lot more focus than it gets – it is one of the biggest environmental challenges we face,” adds Martineau.
“The appropriate, efficient use of inorganic (derived from petrochemicals) and organic (manure) nitrogen fertilisers is a huge deal. It cuts across the entire food system. It’s a critical macronutrient. Standard recommendations may suggest that to get 10 tonnes of wheat (per Ha) you need to apply 220kg of nitrogen but if you only get eight tonnes, there is potentially nitrogen lost to the environment. we have been working closely with farmers to measure and monitor N requirements through the growing season and have seen reductions in application rates as a result without yield impacts.”
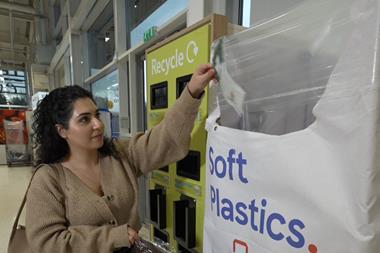
Again, gathering the right data is key. Map of Ag has worked with cereal producers including Kellogg’s to help the reduce the amount of excess nitrogen that’s leached into water courses or lost to the atmosphere by monitoring variables such as soil health, moisture content and crop chlorophyl levels.
“It’s true that you can’t change anything without measuring it first, but you have to make sure that you are measuring the right things,” says Martineau. “By having the right data, you can change aspects of the system that are most critical to the environment while continuing to feed people. It’s about reaching the optimal level of efficiency in the supply chain.”
That distinction is crucial. As much as 70% of food business emissions arise from activities outside their own operations on farms and so understanding these will be the biggest step towards mitigating environmental impact.
To find out more about Map of Ag and the work it is doing visit: https://mapof.ag/