

It’s hard to see a way through the confusion cast by Brexit, and UK food and drink producers have seen slow growth as a result
This year has bought a change in prime minister, a change in Brexit strategy and may yet see a change in government, but as the latest 31 October Brexit deadline looms, the food and drink industry remains no clearer as to whether it is facing the most fundamental regulatory shake-up for generations or business as usual.
Whatever the outcome and however long it drags on, food and drink is facing these headwinds from an uncertain footing.
The 2019 OC&C Top 150 shows overall sales growth across the industry slipping back below its long-term average of 6.4% last year, with the UK’s largest 150 suppliers growing revenues by 4.3% compared with an inflation-driven 7.5% in the previous year.
Perhaps more significantly, industry profit margins fell back for the second consecutive year, dropping to 5.8% from 6.2% in 2017 and 6.7% in 2016. While the margin picture remains healthier than the post-recession years, they remain well below the long-term average of 6.4% as suppliers struggle to pass on cost inflation and rising labour costs.
OC&C UK managing partner Will Hayllar says the industry is in a “slightly worse shape in terms of its underlying fundamentals” heading into the current Brexit D-Day, compared with the previous 29 March deadline.
“The more compressed margins have reduced the wiggle room and to some extent the ammunition that businesses have to make the changes they need to deal with what is still an uncertain Brexit scenario,” he says.
Consumer confidence metrics and wider UK economic indicators have also slid backwards over the course of 2019.
Additionally, the stockpiling response to mitigate border disruption and delays in the event of a no-deal Brexit has been complicated by the proximity of Christmas to the new deadline. “In October there will be more pressure on the retailers because they’re holding greater stocks of Christmas lines,” says Andrew Milne, COO at drinks group Nichols. “So the pressure for us and our co-packers is we need to physically have more space to store additional stock because the retailers are taking less.”
Liberum analyst Robert Waldschmidt feels even stockpiling has reduced in advance of the current Brexit deadline, with companies having “learnt their lesson” from the Brexit delay back in March. “They just have no confidence that anything of note is going to happen and so rather than build up and have to unwind inventory levels - which is costly - it might be cheaper for them to just wear any potential pain,” he says.
The avoidance of the first Brexit deadline has given producers more time to secure supply chains ahead of a UK exit from the EU, such as making alternative arrangements for non-EU sourcing or diversifying transport routes away from heavy traffic routes like the Dover/Calais crossing.
However, overall Brexit preparation has remained limited, according to Hayllar, chiefly because of the cost implications at a time when cash is tight. “The continued uncertainty means there has been a limit on what can be done because these potential solutions often require significant investment and those buttons aren’t being pressed because businesses still don’t know if these solutions will be the right ones or needed in the first place.”
The post-vote slump
While preparing for Brexit is causing headaches, the vote to leave the EU has already had a marked effect on business performance.
Primarily the post-Brexit slump in the value of the pound drove a wave of industry inflation through 2017 and the first part of 2018, due to the resultant increase in costs. The weakness of sterling continues to the present day, with the pound dropping below $1.20 for the first time in 18 months in early September.
“The currency devaluation which happened after the referendum has led to one of the harder inflation spikes to pass through in modern times, given the strong discounter growth mechanic and the fact that everyone is nervous about consumer confidence,” says Hayllar.
OC&C calculates that commodity inflation added £1.7bn of extra costs for producers, which had to absorb around £300m of those in a period where retailers actually grew their margins, passing on £1.7bn of additional costs to the consumer - resulting in consumer price inflation of around 2.5%.
Alantra director Charles Lanceley notes that some producers are only beginning to feel the true effect of currency devaluation in recent months as contracts agreed at lower prices run their course and “there has been a rebasing of cost levels for those who import products”.
The other pre-Brexit pressure beginning to bite is the rising cost of labour at a time the labour pool is already tightening.
Even before any tightening of immigration rules for European labour is enforced, net migration from the EU has slumped 60.8% from June 2016 to December 2018.The figures reflect a 12.9% fall in inward EU migration and more EU nationals leaving the UK due to the falling pound and perceived cultural unwelcomeness.
Food manufacturers recruit 30% of their workforce from this declining pool. At the same time, UK employment costs are also rising due to the living wage legislation.
Despite these pressures, last year employment levels across the Top 150 rose 1.2% to 317,000 employees, driven by a 2.4% increase in own-label workforces.
The labour situation could significantly worsen if Brexit brings restrictions on freedom of movement of EU workers and mooted minimum salary levels for migrants well above those typically paid in food production.
Although not yet reflected in productivity figures, there does appear to have been the start of an industry response, however: capital expenditure notably spiked last year.
Producers increased capex by 16.3% compared with 2017, up to £1.8bn. It now represents 3.4% of total revenues, up from 3.1%.
Hayllar says much of this capex increase is reflective of a need to find efficiencies - both in manufacturing production through automation and also bringing technological solutions to management systems and administrative functions.
Waldschmidt suggests the looming threat of Brexit has also specifically triggered increased capital spend. “Take Kerry Foods, for example,” he says. “They have built local production in the UK so they are not sourcing out of Ireland and others have spent on putting in place plants and logistics solutions to address the need to source more locally.”
Big brands lead on capex
There is, however, a notable contrast between the capex spend of branded and own label players, with the former up 24.8% and the latter just 2.1%. Larger branded players also grew their capex spend at a considerably higher rate than smaller brands at 28.8% compared with 14.4%.
“These figures may be reflective of some of the strength of the big multinational businesses to take medium-term decisions and get on with it,” notes Hayllar. “Even without Brexit the increasing cost of labour was creating an impetus to automate more, so some businesses have felt they should accelerate their investment to find some of that efficiency.”
Automation and efficiencies are not the only drivers of capital spend, with larger brands also digging into their deeper pockets to fund their efforts to find underlying organic growth and adapt products and portfolios for changing consumer tastes.
Big brands have had an especially tough few years, struggling to generate growth while being outmanoeuvred by smaller, more on-trend rivals, while those on the public markets have come under severe pressure to cut costs and boost shareholder returns.
“Even without Brexit the increasing cost of labour was creating an impetus to automate more,”
But there do appear to be signs that the big brands are fighting back.
Underlying organic sales growth accelerated for larger (over £500m of sales) branded companies, rising from 2.1% in 2017 to 3.3% last year, while the sales growth of smaller branded companies was more stable, rising from 4.8% to 5.1%.
Own label, which has enjoyed strong growth in recent years due to the rise of the discounters and the focus of mainstream supermarkets on own-label products, saw sales growth fall from 6.8% to 4.8%, with growth of large own-label producers falling from 5.3% to 3.1%.
“Larger branded players are doing a better job of starting to adapt to this
new environment and finding pockets of growth to enable them to close the gap,” Hayllar says.
Waldschmidt adds: “There has been an increase in innovation as a result of more fragmentation in the consumer offer and we have seen a positive response from the big guys on how to deal with smaller upstarts which have novel interesting authentic products.”
This has been partly driven by the higher capex - such as Coca-Cola European Partners investing cash to shift towards higher-value packaging formats and new categories like energy drinks - and also through acquisition, such as Unilever’s purchase of high-growth snack manufacturer Graze.
Leendert den Hollander, general manager at CCEP Great Britain, believes “the emergence of smaller brands has put more focus on the need to innovate on bigger brands. We need to make sure we keep our current consumers with us and bring something that’s appealing for new consumers because that’s the only way we can grow our penetration.”
The stronger international growth of 5.6% compared with domestic sales growth of 3.6% (see box, p35) also plays into the hands of those companies with global infrastructure and resources with which to build growth outside the UK.
Nichols’ Milne ponders whether range rationalisations at the major multiples have played into the hands of established brands as they reduce SKU numbers while “making sure there remains enough space for big sellers”.
Additionally, big brand owners are putting more effort and focus into tapping growth outside the major supermarkets, with both CCEP and Nichols focusing on out-of-home opportunities, while other large brands have built direct-to-consumer capabilities either organically or through acquisition.
As a result, branded growth converged with own-label last year, having underperformed since 2013. Own label margins also remain less than half of those for branded operators and fell a further 0.3 percentage points to 4.1%.
Channel shift slows
While the structural advantage own label players have in terms of the rate of growth of the discounters has continued, that channel shift away from the mainstream supermarkets appears to be slowing - the discounters had a compound annual growth rate of 25.5% from 2012 to 2016, which has slowed to 10.4% from 2016 to 2019, while the sales of multiples have stabilised.
“The rate of discounter growth is slowing and therefore the scale of the disadvantage for branded players is slowing,” Hayllar says. “The question now is if we do tip into recession and there is a squeeze on consumer disposable incomes, will it drive another step up in private label growth?”
With overall margins already compressed, the industry will face the possibility of another recession with trepidation. A global economic cooldown will only exacerbate the disruption from a disorderly Brexit.
However, Hayllar suggests producers cannot afford to go on the defensive and cut spending.
“The rate of discounter growth is slowing and therefore the scale of the disadvantage for branded players is slowing,”
While the increase in capex last year was welcome, labour productivity remains a key threat for the industry and requires significant further investment. “There are some early positive signs, but what we’ve seen so far is far from full action and certainly not anything like what will be needed to overcome the squeeze on a labour-dependent sector,” he says.
The regulatory impact of Brexit remains uncertain, but it is potentially significant, with a further drop in the value of the pound and changing regulatory standards leading to another spike in costs.
While the industry will not be able to directly shape how the UK’s post-Brexit regulatory landscape shapes up, Hayllar says it does need to remain on the front foot in terms of engagement with government to make sure the issues that matter to the sector are on the table.
But significant changes also create significant opportunities.
“Any disruption will hurt some people and create opportunities for others to improve their competitive position,” Hayllar says. “Smart business should not just think ‘how do we have continuity of trading?’ but ‘how do we move quickly to capitalise on different market dynamics?’”
Opportunities of disruption
Disruption to the flow of foods into the UK could create further opportunities for those who grow or manufacture products within the UK. And diverging standards from the EU could enable additional sourcing of products and ingredients from non-EU sources.
“It cuts both ways,” says Houlihan Lokey co-head of UK corporate finance Shaun Browne. “If you are a manufacturer in the UK primarily supplying UK supermarkets and have been competing with cheap imports from Continental Europe, you could be rubbing your hands with glee.”
There will also still be pockets of growth based on consumer trends - such as meat and dairy alternatives, no and low alcohol, CBD-related innovation - even in recessionary economic conditions. It is down to suppliers to push hard to capitalise on the many growth opportunities that remain.
“The best way of reinforcing margins is to have stuff that people want to buy,” Hayllar concludes. “It’s much harder to prop something up that’s tired with falling sales as the only way your customers can grow category profit is by coming and asking for lower prices.”
With the likelihood of a no-deal Brexit, the timing of the UK’s exit or even the possibility of rescinding Brexit entirely shifting on a daily basis, food and drink manufacturers will be cursing the impact of the endless uncertainty. Even in these foggy times, however, those who succeed will be focused on the longer-term and invest in a plan to support growth and margins well beyond any Brexit and capitalise on the UK’s exciting and dynamic food and drink market.
The economic fog may have descended, but it will eventually clear - and those on the right path when it does will continue to profit.
OC&C TOP 150
| Rank | Change in Rank | Company Name | Parent Company | Ownership Type | Activity | Annualised Turnover (£m) | Turnover Growth (%) | Operating Profit (£m) | Profit Growth (%) | Operating Margin (%) | Delta Op Margin | ROCE (%) | Year End | ||||
|---|---|---|---|---|---|---|---|---|---|---|---|---|---|---|---|---|---|
| Current | Previous | Current | Previous | Current | Previous | 0 | Current | Previous | |||||||||
| 1 | - | Associated British Foods | ASSOCIATED BRITISH FOODS PLC | Subsidiary of larger group | Brand | 3,429 | 3,390 | 1.2% | 339 | 311 | 9.2% | 9.9% | 9.2% | 0.7% | 11.6% | 11.3% | Sep-18 |
| 2 | - | Boparan Holdings | Boparan Midco Limited | Family or closely-owned | Own Label | 3,348 | 3,298 | 1.5% | (11) | 46 | N/A | -0.3% | 1.4% | -1.7% | -2.4% | 8.6% | Jul-18 |
| 3 | - | Arla Foods | Arla Foods amba | Subsidiary of larger group | Own Label | 2,536 | 2,340 | 8.4% | 33 | 45 | -27.8% | 1.3% | 1.9% | -0.6% | 3.7% | 7.2% | Dec-17 |
| 4 | +1 | Muller UK & Ireland | Unternehmensgruppe Theo Muller S.e.c.s | Subsidiary of larger group | Brand | 2,104 | 1,979 | 6.3% | 36 | 43 | -14.6% | 1.7% | 2.2% | -0.4% | 8.2% | 10.9% | Dec-17 |
| 5 | +2 | Coca-Cola Enterprises | Bottling Great Britain Limited | Subsidiary of larger group | Brand | 2,064 | 1,831 | 12.7% | 303 | 298 | 1.9% | 14.7% | 16.3% | -1.6% | 36.7% | 35.3% | Dec-18 |
| 6 | - | Unilever UK | Unilever PLC | Subsidiary of larger group | Brand | 1,858 | 1,829 | 1.6% | 85 | 70 | 22.4% | 4.6% | 3.8% | 0.8% | 9.5% | 8.3% | Dec-17 |
| 7 | +1 | Bakkavor | Bakkavor Group | UK Listed | Own Label | 1,820 | 1,735 | 4.9% | 113 | 108 | 4.6% | 6.2% | 6.2% | -0.0% | 66.4% | 75.3% | Dec-17 |
| 8 | +1 | Mondelez UK | MONDELEZ INTERNATIONAL, INC. | Subsidiary of larger group | Brand | 1,661 | 1,643 | 1.1% | 48 | 33 | 47.3% | 2.9% | 2.0% | 0.9% | 1.8% | 1.2% | Dec-17 |
| 9 | +6 | Hilton Food Group | Hilton Food Group PLC | UK Listed | Own Label | 1,654 | 1,361 | 21.5% | 50 | 38 | 31.2% | 3.0% | 2.8% | 0.2% | 25.3% | 27.8% | Dec-18 |
| 10 | +2 | Princes | Mitsubishi Corp | Subsidiary of larger group | Brand | 1,618 | 1,507 | 7.4% | 9 | 14 | -33.6% | 0.6% | 0.9% | -0.4% | 1.5% | 2.3% | Mar-18 |
| 11 | (1) | Nestle UK | Nestle SA | Subsidiary of larger group | Brand | 1,585 | 1,525 | 3.9% | 169 | 186 | -9.0% | 10.7% | 12.2% | -1.5% | 4.7% | 5.9% | Dec-17 |
| 12 | (1) | Britvic Plc | Britvic Plc | UK Listed | Brand | 1,508 | 1,434 | 5.1% | 188 | 195 | -3.4% | 12.5% | 13.6% | -1.1% | 22.8% | 26.3% | Sep-18 |
| 13 | +1 | Moy Park | JBS SA | Subsidiary of larger group | Own Label | 1,506 | 1,397 | 7.8% | 71 | 66 | 7.0% | 4.7% | 4.7% | -0.0% | 19.9% | 19.6% | Dec-17 |
| 14 | (10) | Greencore Convenience Foods | Greencore Group PLC | UK Listed | Own Label | 1,503 | 1,442 | 4.2% | 87 | 95 | -8.5% | 5.8% | 6.6% | -0.8% | 11.8% | 23.4% | Sep-18 |
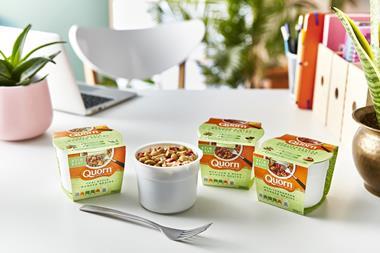
| 15 | (2) | Cranswick | CRANSWICK PLC | UK Listed | Own Label | 1,437 | 1,465 | -1.9% | 89 | 91 | -1.3% | 6.2% | 6.2% | 0.0% | 23.6% | 27.8% | Mar-19 |
| 16 | +1 | Mars UK | Mars Inc. | Subsidiary of larger group | Brand | 1,064 | 1,106 | -3.8% | 120 | 215 | -44.1% | 11.3% | 19.4% | -8.1% | 14.2% | 19.8% | Dec-17 |
| 17 | +1 | Tulip | Danish Crown Group | Subsidiary of larger group | Own Label | 1,062 | 1,065 | -0.2% | (40) | (34) | N/A | -3.8% | -3.2% | -0.6% | -12.0% | -8.8% | Sep-18 |
| 18 | +1 | Samworth Brothers | SAMWORTH BROTHERS LIMITED | Family or closely-owned | Own Label | 1,020 | 955 | 6.9% | 30 | 49 | -38.0% | 3.0% | 5.1% | -2.1% | 8.5% | 14.6% | Dec-17 |
| 19 | New | Dunbia | QDB Holdings | Family or closely-owned | Own Label | 905 | 756 | 19.7% | 11 | 5 | 133.2% | 1.2% | 0.6% | 0.6% | 5.3% | 3.1% | Dec-17 |
| 20 | - | United Biscuits | Yildiz Holding | Subsidiary of larger group | Brand | 875 | 871 | 0.4% | 84 | 89 | -6.5% | 9.6% | 10.3% | -0.7% | 2.7% | 3.1% | Dec-17 |
| 21 | - | Premier Foods | Premier Foods Plc | UK Listed | Brand | 827 | 821 | 0.6% | 41 | 107 | -61.7% | 5.0% | 13.1% | -8.1% | 24.6% | 71.0% | Mar-19 |
| 22 | +7 | Avara Foods (formerly Faccenda) | Faccenda and Cargill | Subsidiary of larger group | Own Label | 820 | 521 | 57.5% | 24 | 12 | 98.8% | 2.9% | 2.3% | 0.6% | 10.3% | 7.0% | May-18 |
| 23 | (1) | Kellogg’s | Kellogg Company Inc. | Subsidiary of larger group | Brand | 725 | 775 | -6.4% | 20 | 19 | 6.5% | 2.8% | 2.5% | 0.3% | 9.8% | 9.9% | Dec-17 |
| 24 | (1) | H.J. Heinz Foods | The Kraft Heinz Company, | Subsidiary of larger group | Brand | 720 | 711 | 1.2% | 127 | 108 | 17.8% | 17.7% | 15.2% | 2.5% | 6.7% | 5.5% | Dec-17 |
| 25 | - | Fletcher Bay Group | Fletcher Bay Group Ltd. | Family or closely-owned | Own Label | 709 | 670 | 5.7% | 5 | 15 | -63.7% | 0.8% | 2.2% | -1.4% | 5.5% | 18.9% | Dec-17 |
| 26 | (2) | Farmers Boy | Wm Morrison Supermarkets PLC | Subsidiary of larger group | Own Label | 667 | 687 | -2.9% | 19 | 72 | -73.2% | 2.9% | 10.5% | -7.6% | 3.1% | 16.4% | Feb-18 |
| 27 | (1) | Neerock | Wm Morrison Supermarkets PLC | Subsidiary of larger group | Own Label | 606 | 631 | -4.0% | 15 | 40 | -62.3% | 2.5% | 6.3% | -3.8% | 3.3% | 13.2% | Feb-18 |
| 28 | (1) | Hain Celestial Group | The Hain Celestial Group Inc | Subsidiary of larger group | Brand | 585 | 567 | 3.1% | 37 | 41 | -11.6% | 6.3% | 7.3% | -1.0% | 10.4% | 14.3% | Jun-18 |
| 29 | +5 | Karro Food | Capvest | Private Equity | Own Label | 575 | 587 | -2.0% | (1) | 15 | N/A | -0.1% | 2.6% | -2.7% | -0.5% | 9.9% | Dec-18 |
| 30 | (14) | Wm Morrison Produce | Wm Morrison Supermarkets PLC | Subsidiary of larger group | Own Label | 557 | 1,311 | -57.5% | 12 | 71 | -82.9% | 2.2% | 5.4% | -3.2% | 3.3% | 25.1% | Feb-18 |
| 31 | (3) | Young’s Seafood Ltd | Lion/Gem Luxembourg 3 s.a.r.l | Private Equity | Brand | 546 | 523 | 4.3% | (7) | (33) | N/A | -1.2% | -6.4% | 5.2% | -1.7% | -9.2% | Sep-18 |
| 32 | +1 | McCain Foods (GB) | McCain Foods Group Inc | Subsidiary of larger group | Brand | 512 | 466 | 9.7% | 58 | 49 | 19.1% | 11.3% | 10.4% | 0.9% | 31.4% | 32.3% | Jun-18 |
| 33 | (3) | Warburtons | Warburtons 1876 Limited | Family or closely-owned | Brand | 508 | 516 | -1.6% | (13) | 22 | N/A | -2.6% | 4.3% | -6.9% | -3.0% | 4.9% | Sep-18 |
| 34 | +5 | Kerry Foods | Kerry Group PLC | Subsidiary of larger group | Brand | 488 | 412 | 18.2% | 42 | 46 | -8.7% | 8.7% | 11.2% | -2.6% | 5.5% | 4.1% | Dec-17 |
| 35 | (3) | G’s Group Holdings | G’s Group Holdings Ltd | Family or closely-owned | Own Label | 474 | 485 | -2.2% | 4 | 4 | -18.8% | 0.8% | 0.9% | -0.2% | 2.0% | 2.9% | May-18 |
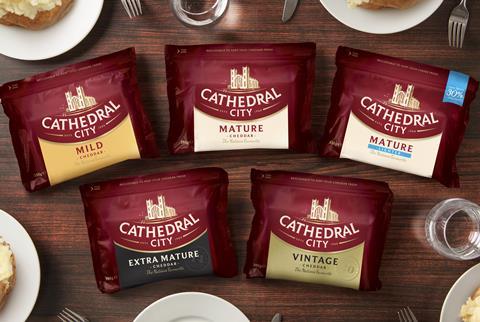
| 36 | +1 | Dairy Crest Group | Dairy Crest Group Plc | Subsidiary of larger group | Brand | 457 | 417 | 9.6% | 59 | 52 | 13.3% | 12.9% | 12.5% | 0.4% | 14.5% | 12.6% | Mar-18 |
| 37 | (1) | Danish Crown UK | Danish Crown A/S | Subsidiary of larger group | Own Label | 451 | 463 | -2.7% | 7 | 4 | 48.0% | 1.5% | 1.0% | 0.5% | 16.0% | 10.1% | Sep-18 |
| 38 | +6 | Dale Farm | Dale Farm Cooperative Limited | Subsidiary of larger group | Own Label | 426 | 341 | 24.8% | 11 | 9 | 25.8% | 2.6% | 2.6% | 0.0% | 7.8% | 6.8% | Mar-18 |
| 39 | +2 | Ferrero UK | Ferrero International SA | Subsidiary of larger group | Brand | 420 | 384 | 9.5% | 11 | 2 | 622.8% | 2.7% | 0.4% | 2.3% | 11.7% | 2.3% | Aug-18 |
| 40 | (2) | Lucozade Ribena | SUNTORY | Subsidiary of larger group | Brand | 412 | 418 | -1.4% | 76 | 75 | 0.9% | 18.4% | 17.9% | 0.4% | 45.5% | 45.6% | Dec-18 |
| 41 | (1) | Birds Eye | Nomad Foods Limited | Subsidiary of larger group | Brand | 407 | 398 | 2.2% | 20 | 17 | 19.4% | 4.9% | 4.2% | 0.7% | 10.0% | 9.0% | Dec-17 |
| 42 | - | James Finlay | John Swire & Sons Limited | Subsidiary of larger group | Own Label | 389 | 353 | 10.0% | 29 | 18 | 57.8% | 7.4% | 5.1% | 2.2% | 4.6% | 3.7% | Dec-17 |
| 43 | (8) | Sun Valley Foods | Cargill Inc | Subsidiary of larger group | Own Label | 382 | 464 | -17.7% | (5) | 2 | N/A | -1.2% | 0.4% | -1.6% | -5.0% | 1.6% | May-18 |
| 44 | +1 | Jacobs Douwe Egberts | Jacobs Douwe Egberts B.V. | Subsidiary of larger group | Brand | 357 | 336 | 6.5% | 17 | 14 | 16.9% | 4.7% | 4.3% | 0.4% | 46.8% | 45.3% | Dec-17 |
| 45 | (14) | Fresca Group | Fresca Group Limited | Family or closely-owned | Own Label | 354 | 381 | -7.3% | 6 | 7 | -14.9% | 1.6% | 1.8% | -0.1% | 8.3% | 10.3% | Apr-18 |
| 46 | New | Foyle Food Group Limited | Foyle Food Group Holdings Limited | Family or closely-owned | Own Label | 352 | 305 | 15.3% | 6 | 6 | -2.8% | 1.6% | 1.9% | -0.3% | 7.5% | 8.3% | Dec-17 |
| 47 | +2 | J.W. Galloway | J.W. GALLOWAY LIMITED | Family or closely-owned | Own Label | 350 | 321 | 9.2% | 8 | 6 | 29.0% | 2.4% | 2.0% | 0.4% | 14.7% | 12.5% | Feb-18 |
| 48 | (5) | KP Snacks | Intersnack Group | Subsidiary of larger group | Brand | 347 | 314 | 10.3% | 51 | 54 | -4.7% | 14.8% | 17.1% | -2.3% | 54.8% | 89.8% | Dec-17 |
| 49 | (2) | Noble Foods | Noble Foods Group Limited | Family or closely-owned | Own Label | 346 | 328 | 5.3% | 13 | 6 | 127.5% | 3.6% | 1.7% | 1.9% | 7.5% | 5.1% | Sep-18 |
| 50 | +6 | Baxters Food Group | W.A. Baxter and Sons (Holdings) Limited | Family or closely-owned | Brand | 339 | 298 | 13.9% | 18 | 15 | 19.8% | 5.3% | 5.0% | 0.3% | 12.8% | 10.5% | Mar-18 |
| 51 | +3 | Berry Gardens | Berry Gardens Growers Limited | Family or closely-owned | Own Label | 339 | 310 | 9.1% | 6 | 6 | -1.4% | 1.6% | 1.8% | -0.2% | 26.8% | 32.3% | Dec-17 |
| 52 | (6) | Fyffes Group | Fyffes PLC | UK Listed | Brand | 337 | 330 | 1.9% | 2 | (1) | N/A | 0.7% | -0.4% | 1.1% | 3.3% | -3.1% | Dec-17 |
| 53 | - | Refresco Beverages | Refresco B.V. | Subsidiary of larger group | Own Label | 336 | 315 | 6.8% | 9 | 12 | -29.3% | 2.5% | 3.8% | -1.3% | 8.7% | 14.1% | Dec-17 |
| 54 | +1 | Hovis | Gores Group (Alternative) Ltd | Private Equity | Brand | 327 | 308 | 6.2% | (2) | (9) | N/A | -0.5% | -3.0% | 2.4% | -1.9% | -9.2% | Dec-17 |
| 55 | +8 | Innocent | The Coca Cola Company | Subsidiary of larger group | Brand | 326 | 268 | 21.5% | 16 | 13 | 27.6% | 4.9% | 4.7% | 0.2% | 22.3% | 14.7% | Dec-18 |
| 56 | (6) | Ornua Foods | Ornua Co-Operative Limited | Subsidiary of larger group | Brand | 321 | 320 | 0.2% | 10 | 11 | -4.9% | 3.2% | 3.3% | -0.2% | 9.9% | 10.0% | Dec-18 |
| 57 | +1 | LDH (La Doria) Limited | La Doria SpA | Subsidiary of larger group | Own Label | 313 | 284 | 10.4% | 10 | 14 | -30.2% | 3.0% | 4.8% | -1.8% | 12.7% | 20.0% | Dec-17 |
| 58 | (6) | Finsbury Food Group | Finsbury Food Group PLC | UK Listed | Brand | 304 | 315 | -3.4% | 6 | 13 | -52.5% | 2.0% | 4.1% | -2.1% | 10.5% | 24.5% | Jun-18 |
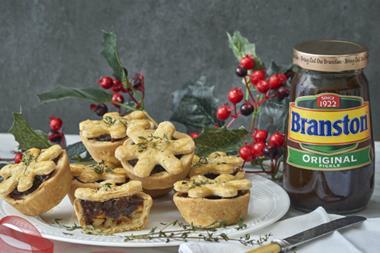
| 59 | (11) | Weetabix | Post Holdings, Inc. | Subsidiary of larger group | Brand | 303 | 323 | -6.3% | 60 | 49 | 20.8% | 19.7% | 15.3% | 4.4% | 17.7% | 16.8% | Sep-18 |
| 60 | - | Oscar Mayer | Deutsche Beteiligungs AG | Private Equity | Own Label | 298 | 273 | 9.1% | 9 | 13 | -29.5% | 3.1% | 4.8% | -1.7% | 13.1% | 22.4% | Mar-18 |
| 61 | (4) | Yeo Valley Group | TWT Mead | Family or closely-owned | Brand | 295 | 283 | 4.4% | 3 | 10 | -66.2% | 1.1% | 3.5% | -2.4% | 4.6% | 16.8% | May-18 |
| 62 | (11) | William Jackson & Son | WILLIAM JACKSON & SON LIMITED | Family or closely-owned | Brand | 287 | 318 | -9.7% | 13 | 19 | -31.2% | 4.6% | 6.0% | -1.4% | 11.5% | 19.5% | Apr-18 |
| 63 | +1 | General Mills UK | General Mills, Inc | Subsidiary of larger group | Brand | 287 | 264 | 8.9% | 7 | 7 | 3.6% | 2.4% | 2.5% | -0.1% | 8.5% | 7.0% | May-18 |
| 64 | (5) | A. G. Barr | A.G. BARR P.L.C. | UK Listed | Brand | 280 | 265 | 5.6% | 47 | 48 | -3.9% | 16.6% | 18.3% | -1.7% | 36.0% | 40.6% | Jan-19 |
| 65 | (4) | Addo Food Group | LDC Limited | Private Equity | Own Label | 273 | 272 | 0.6% | 7 | 11 | -35.9% | 2.7% | 4.2% | -1.5% | 12.5% | 30.7% | Mar-18 |
| 66 | +3 | Red Bull Company | Jerrard Co Limited | Subsidiary of larger group | Brand | 272 | 243 | 12.1% | 23 | 21 | 11.6% | 8.5% | 8.5% | -0.0% | 67.7% | 60.3% | Dec-17 |
| 67 | (5) | K.T.C. (Edibles) | K.T.C. (EDIBLES) LIMITED | Family or closely-owned | Own Label | 266 | 268 | -0.7% | 4 | 4 | -3.7% | 1.5% | 1.6% | -0.0% | 8.0% | 9.6% | Dec-18 |
| 68 | (1) | Walkers Snack Foods | PepsiCo Inc | Subsidiary of larger group | Brand | 257 | 248 | 3.6% | 21 | 28 | -25.8% | 8.2% | 11.4% | -3.2% | 5.5% | 6.8% | Dec-17 |
| 69 | New | CSM (UK) Limited | Rhone Capital IV L.P | Private Equity | Own label | 252 | 263 | -4.1% | 3 | (11) | N/A | 1.3% | -4.2% | 5.5% | 4.5% | -17.0% | Dec-18 |
| 70 | +2 | McCormick UK | Mccormick and Company inc | Subsidiary of larger group | Brand | 250 | 239 | 4.4% | 15 | 17 | -11.0% | 6.1% | 7.1% | -1.1% | 8.9% | 10.3% | Nov-17 |
| 71 | (5) | Adelie Foods | Intermediate Capital Group | Private Equity | Own Label | 249 | 248 | 0.2% | (9) | (17) | N/A | -3.6% | -7.0% | 3.4% | -24.9% | -29.9% | Sep-18 |
| 72 | (4) | Froneri UK (R&R Ice Cream) | PAI Partners / Nestle | Private Equity | Own Label | 243 | 220 | 10.6% | 42 | 39 | 7.2% | 17.2% | 17.8% | -0.6% | 25.3% | 25.3% | Dec-17 |
| 73 | (3) | International Procurement & Logistics | Asda Stores Limited | Subsidiary of larger group | Own Label | 242 | 242 | 0.0% | 15 | 33 | -56.0% | 6.0% | 13.7% | -7.7% | 8.2% | 28.8% | Dec-17 |
| 74 | (3) | Wrigley Company | Mars Inc. | Subsidiary of larger group | Brand | 242 | 248 | -2.6% | 54 | 66 | -18.5% | 22.3% | 26.7% | -4.4% | 28.2% | 60.9% | Dec-17 |
| 75 | +16 | Fevertree | Fevertree Drinks Plc | UK Listed | Brand | 237 | 170 | 39.5% | 76 | 57 | 33.1% | 32.2% | 33.7% | -1.6% | 64.9% | 77.6% | Dec-18 |
| 76 | (11) | Burton’s Foods Limited | Ontario Teachers’ Pension Plan | Private Equity | Brand | 233 | 249 | -6.4% | (10) | 4 | N/A | -4.4% | 1.6% | -6.0% | -2.5% | 1.3% | Dec-17 |
| 77 | (2) | Stateside Foods | Suedzucker AG | Subsidiary of larger group | Own Label | 230 | 215 | 7.1% | 9 | 12 | -23.3% | 3.9% | 5.4% | -1.5% | 20.7% | 28.1% | Feb-18 |
| 78 | New | Barry Callebaut Manufacturing | Jacobs Holding Ag | Family or closely-owned | Brand | 227 | 217 | 4.8% | 2 | 1 | 81.5% | 1.0% | 0.6% | 0.4% | 2.8% | 1.9% | Aug-18 |
| 79 | (5) | Noon Products | Kerry Group PLC | Subsidiary of larger group | Own Label | 222 | 220 | 0.8% | 7 | 10 | -34.1% | 3.1% | 4.8% | -1.6% | 3.5% | 6.0% | Dec-17 |
| 80 | (7) | John West Foods | Thai Union Frozen Products Public Company Limted | Subsidiary of larger group | Brand | 221 | 222 | -0.4% | 2 | 4 | -51.3% | 1.0% | 2.0% | -1.0% | 2.5% | 5.9% | Dec-17 |
| 81 | (5) | Quorn Foods | Monde Nissin | Subsidiary of larger group | Brand | 220 | 205 | 7.4% | 27 | 32 | -14.3% | 12.4% | 15.5% | -3.1% | 17.8% | 24.5% | Dec-18 |
| 82 | +5 | Country Style Foods | COUNTRY STYLE FOODS LIMITED | Family or closely-owned | Own Label | 210 | 172 | 21.7% | 4 | 6 | -37.1% | 1.9% | 3.6% | -1.8% | 9.1% | 16.1% | Apr-18 |
| 83 | (1) | Bettys & Taylors Group | BETTYS & TAYLORS GROUP LTD | Family or closely-owned | Brand | 208 | 190 | 9.7% | 12 | 16 | -27.6% | 5.6% | 8.6% | -2.9% | 9.0% | 12.9% | Oct-18 |
| 84 | (6) | Linden Foods | Fane Valley Co-Operative Society Limited | Subsidiary of larger group | Own Label | 207 | 199 | 3.7% | 2 | 1 | 165.6% | 0.9% | 0.4% | 0.6% | 5.0% | 1.6% | Sep-18 |
| 85 | +19 | CP Foods (UK) | CPF Group | Subsidiary of larger group | Own Label | 206 | 152 | 35.5% | 5 | 2 | 119.1% | 2.4% | 1.5% | 0.9% | 6.6% | 3.5% | Dec-17 |
| 86 | (9) | Danone Waters (UK & Ireland) | Danone SA | Subsidiary of larger group | Brand | 203 | 198 | 2.3% | 11 | 11 | 4.8% | 5.5% | 5.4% | 0.1% | 55.7% | 53.2% | Dec-17 |
| 87 | +15 | Scottish Sea Farms | Leroy Seafood Group ASA, Salmar AS | Subsidiary of larger group | Own Label | 200 | 154 | 29.9% | 63 | 42 | 48.9% | 31.4% | 27.4% | 4.0% | 59.5% | 47.2% | Dec-17 |
| 88 | - | Lactalis McLelland | BSA | Subsidiary of larger group | Own Label | 200 | 172 | 16.0% | 17 | 9 | 94.0% | 8.4% | 5.1% | 3.4% | 12.9% | 6.5% | Dec-17 |
| 89 | (9) | Danone | Danone SA | Subsidiary of larger group | Brand | 196 | 201 | -2.3% | 12 | 34 | -64.9% | 6.2% | 17.1% | -11.0% | 26.6% | 72.1% | Dec-17 |
| 90 | (9) | Greencell | Hans Merensky Holdings Limited | Family or closely-owned | Own Label | 196 | 194 | 1.1% | 5 | 5 | -0.0% | 2.5% | 2.6% | -0.0% | 34.2% | 35.8% | Dec-18 |
| 91 | New | Direct Produce Supplies Limited | Terradace Holdings Limited | Family or closely-owned | Own Label | 196 | 118 | 66.6% | 3 | 3 | 22.4% | 1.7% | 2.3% | -0.6% | 47.2% | 69.4% | Sep-18 |
| 92 | (13) | Produce Investments | Produce Investments PLC | UK Listed | Own Label | 189 | 197 | -4.2% | 7 | 8 | -20.1% | 3.5% | 4.2% | -0.7% | 8.2% | 9.9% | Jun-18 |
| 93 | +47 | Bernard Matthews Holdings | Amber REI Holdings Limited | Subsidiary of larger group | Brand | 188 | 95 | 97.7% | 5 | 2 | 121.5% | 2.7% | 2.4% | 0.3% | 19.2% | 5.6% | Dec-17 |
| 94 | (4) | Tayto Group | Manderley Food Group | Family or closely-owned | Brand | 186 | 171 | 8.5% | 3 | 4 | -21.4% | 1.8% | 2.5% | -0.7% | 3.1% | 5.3% | Jun-18 |
| 95 | (10) | Zetar | Zertus Group | Subsidiary of larger group | Brand | 184 | 184 | 0.2% | 4 | (6) | N/A | 1.9% | -3.3% | 5.2% | 4.8% | -7.3% | Dec-18 |
| 96 | +4 | Alpro UK | Danone SA | Subsidiary of larger group | Brand | 183 | 157 | 17.0% | 8 | 6 | 33.0% | 4.4% | 3.9% | 0.5% | 14.6% | 12.5% | Dec-17 |
| 97 | (13) | Upfield Foods (Unilever BCS UK) | KKR | Private Equity | Brand | 183 | 212 | -13.4% | 8 | 15 | -47.7% | 4.3% | 7.1% | -2.8% | 12.7% | 20.6% | Dec-17 |
| 98 | (2) | Natures Way Foods | Natures Way Foods Europe Limited | Family or closely-owned | Own Label | 183 | 163 | 12.1% | 3 | 6 | -44.2% | 1.7% | 3.5% | -1.7% | 7.1% | 15.5% | Mar-18 |
| 99 | (13) | Haribo | Haribo Holding GmbH & Co. KG | Subsidiary of larger group | Brand | 182 | 173 | 5.2% | 22 | 20 | 8.2% | 11.9% | 11.6% | 0.3% | 13.4% | 13.1% | Dec-18 |
| 100 | (6) | Winterbotham Darby &Co | Equistone | Private Equity | Own Label | 176 | 166 | 5.8% | 4 | 4 | -3.0% | 2.1% | 2.3% | -0.2% | 3.1% | 6.4% | Mar-18 |
| 101 | (2) | S H PRATT & COMPANY | S H PRATT & COMPANY LIMITED | Family or closely-owned | Own Label | 174 | 157 | 10.7% | 3 | 3 | 9.4% | 1.6% | 1.6% | -0.0% | 18.2% | 18.7% | Oct-18 |
| 102 | (13) | Lindt & Sprungli (U.K.) | Chocoladefabriken Lindt & Sprungli AG | Subsidiary of larger group | Brand | 171 | 155 | 10.9% | 13 | 19 | -32.8% | 7.4% | 12.2% | -4.8% | 51.1% | 68.7% | Dec-17 |
| 103 | (11) | DOVECOTE PARK | Extra Detail Limited | Family or closely-owned | Own Label | 171 | 170 | 0.9% | 3 | 3 | 10.0% | 1.7% | 1.5% | 0.1% | 10.0% | 9.7% | Sep-18 |
| 104 | (7) | Park Cakes | Park Cakes Holdings Limited | Private Equity | Own Label | 171 | 163 | 5.1% | 1 | 3 | -61.5% | 0.7% | 1.9% | -1.2% | 5.3% | 20.9% | Mar-18 |
| 105 | (12) | Greenyard Fresh UK | Greenyard Foods N.V. | Subsidiary of larger group | Own Label | 166 | 168 | -1.5% | 2 | 1 | 89.4% | 1.1% | 0.6% | 0.5% | 27.9% | 6.7% | Mar-18 |
| 106 | - | Browns Food Group | BROWNS FOOD GROUP LIMITED | Family or closely-owned | Own Label | 164 | 151 | 8.7% | 8 | 8 | 7.6% | 5.0% | 5.1% | -0.0% | 21.0% | 17.7% | Dec-17 |
| 107 | (9) | Dr Oetker (UK) | Dr August Oetker KG | Subsidiary of larger group | Brand | 161 | 157 | 2.6% | 19 | 27 | -31.6% | 11.6% | 17.4% | -5.8% | 25.7% | 39.6% | Dec-17 |
| 108 | +12 | Angus Soft Fruits | Mr LM Porter | Family or closely-owned | Own Label | 160 | 124 | 28.7% | 1 | 1 | 8.5% | 0.6% | 0.7% | -0.1% | 9.2% | 12.1% | Apr-18 |
| 109 | (6) | Barfoots of Botley | Mr P Barfoot | Family or closely-owned | Own Label | 158 | 152 | 3.5% | 8 | 6 | 45.3% | 5.1% | 3.6% | 1.5% | 26.0% | 23.6% | Dec-17 |
| 110 | (15) | Direct Table Foods | Tönnies Holding GmbH & Co. KG | Subsidiary of larger group | Own Label | 156 | 165 | -5.1% | 5 | 12 | -60.7% | 2.9% | 7.0% | -4.1% | 10.0% | 26.2% | Dec-17 |
| 111 | New | International Seafoods | Wm Morrison Supermarkets PLC | Subsidiary of larger group | Own Label | 155 | 141 | 10.1% | 4 | 1 | 196.0% | 2.6% | 1.0% | 1.6% | 18.7% | 7.5% | Feb-18 |
| 112 | (7) | New England Seafood | Mr M R C Stroyan | Family or closely-owned | Own Label | 155 | 151 | 2.2% | 3 | 5 | -26.6% | 2.2% | 3.0% | -0.9% | 13.3% | 19.3% | Oct-18 |
| 113 | (1) | Fayrefield Foods | Fayrefield Group | Family or closely-owned | Own Label | 155 | 141 | 9.7% | 2 | 3 | -46.6% | 1.2% | 2.4% | -1.2% | 4.6% | 10.9% | Dec-17 |
| 114 | (13) | JBS UK | JBS S. A. | Subsidiary of larger group | Own Label | 154 | 156 | -0.9% | 6 | 7 | -2.8% | 4.1% | 4.2% | -0.1% | 14.4% | 16.7% | Dec-17 |
| 115 | +13 | The Scottish Salmon Company | The Scottish Salmon Company PLC | Family or closely-owned | Own Label | 151 | 110 | 37.7% | 30 | (0) | N/A | 19.6% | -0.3% | 19.9% | 27.2% | -0.4% | Dec-17 |
| 116 | +6 | Mowi Consumer Product UK Limited | Marine Harvest ASA | Subsidiary of larger group | Own Label | 145 | 124 | 17.0% | 9 | (8) | N/A | 6.3% | -6.4% | 12.7% | 16.8% | -15.4% | Dec-17 |
| 117 | (6) | Walkers Shortbread | WALKERS SHORTBREAD LIMITED | Family or closely-owned | Brand | 143 | 138 | 3.4% | 6 | 15 | -61.6% | 4.1% | 11.0% | -6.9% | 6.3% | 16.9% | Dec-17 |
| 118 | (11) | Whitworths | Mr Osman Oz | Subsidiary of larger group | Own Label | 143 | 147 | -2.8% | (1) | (26) | N/A | -0.9% | -17.8% | 16.9% | -4.8% | -48.9% | Dec-17 |
| 119 | (3) | Nichols | Nichols PLC | UK Listed | Brand | 142 | 133 | 7.0% | 32 | 21 | 48.4% | 22.4% | 16.2% | 6.3% | 35.2% | 29.1% | Dec-18 |
| 120 | (11) | TATA Global beverages | TATA GLOBAL BEVERAGES GB LIMITED | Subsidiary of larger group | Brand | 140 | 145 | -3.2% | 8 | 10 | -20.6% | 5.4% | 6.6% | -1.2% | 4.7% | 5.2% | Mar-18 |
| 121 | (6) | Lantmannen Unibake UK | Lantmannen EK FOR | Subsidiary of larger group | Own Label | 140 | 136 | 3.1% | (1) | 5 | N/A | -0.5% | 4.0% | -4.5% | -1.2% | 9.0% | Dec-17 |
| 122 | New | Kolak Snack Foods Limited | Europe Snacks S.A.. | Private Equity | Own label | 138 | 121 | 13.9% | 12 | 17 | -33.3% | 8.4% | 14.4% | -6.0% | 23.1% | 42.3% | Jan-18 |
| 123 | (4) | Kettle Produce | Kettle Produce Ltd | Family or closely-owned | Own Label | 136 | 129 | 5.8% | 5 | 3 | 77.6% | 3.4% | 2.0% | 1.4% | 19.3% | 12.4% | Jun-18 |
| 124 | New | Rowse | Valeo Foods | Subsidiary of larger group | Brand | 135 | 123 | 9.7% | 25 | 21 | 20.3% | 18.3% | 16.7% | 1.6% | 9.6% | 9.3% | Mar-18 |
| 125 | (15) | Branston Holding | BRANSTON HOLDING LIMITED | Family or closely-owned | Brand | 134 | 143 | -6.6% | 5 | 7 | -30.2% | 3.5% | 4.6% | -1.2% | 11.3% | 17.5% | Jul-18 |
| 126 | (18) | Albert Bartlett & Sons (Airdrie) | ALBERT BARTLETT & SONS (AIRDRIE) LIMITED | Family or closely-owned | Own Label | 130 | 146 | -10.4% | 6 | 2 | 273.3% | 4.7% | 1.1% | 3.6% | 8.8% | 2.7% | May-18 |
| 127 | (9) | Banham Poultry | Banham Group Limited | Family or closely-owned | Own Label | 129 | 120 | 7.1% | 1 | (0) | N/A | 0.4% | -0.4% | 0.8% | 5.2% | -6.0% | Mar-17 |
| 128 | (11) | Lactalis Nestle Chilled Dairy Company | BSA | Subsidiary of larger group | Brand | 127 | 130 | -1.6% | 3 | 5 | -43.5% | 2.0% | 3.5% | -1.5% | 13.6% | 26.2% | Dec-17 |
| 129 | New | Flamingo Produce LTD | Zara Holdings Sarl | Family or closely-owned | Own Label | 127 | 123 | 2.9% | 7 | 3 | 93.6% | 5.3% | 2.8% | 2.5% | 59.5% | 43.1% | Dec-18 |
| 130 | +1 | Northcoast Seafoods | Kangamiut Seafood A/S | Family or closely-owned | Own Label | 127 | 108 | 17.4% | 3 | 4 | -26.4% | 2.5% | 3.9% | -1.5% | 6.6% | 10.6% | Dec-17 |
| 131 | (48) | Russell Burgess | Russell Burgess Limited | Family or closely-owned | Own Label | 124 | 185 | -33.2% | 1 | (6) | N/A | 0.6% | -3.1% | 3.7% | 3.2% | -25.4% | Dec-17 |
| 132 | (3) | Alliance Group (NZ) | Alliance Group Limited | Subsidiary of larger group | Own Label | 122 | 109 | 11.7% | 1 | (2) | N/A | 1.2% | -1.5% | 2.7% | 4.7% | -6.2% | Sep-18 |
| 133 | +14 | Pritchitts | Lakeland Dairies Co-operative Society Limited | Subsidiary of larger group | Own Label | 121 | 89 | 35.9% | 2 | 1 | 199.9% | 1.6% | 0.7% | 0.9% | 8.4% | 2.9% | Dec-17 |
| 134 | (8) | Symington’s | Speedboat Holdco Limited / Intermediate Capital Group | Private Equity | Brand | 121 | 115 | 4.7% | 7 | 4 | 62.2% | 5.7% | 3.7% | 2.0% | 15.7% | 12.9% | Aug-18 |
| 135 | (14) | Yoplait UK | General Mills Inc | Subsidiary of larger group | Brand | 121 | 126 | -4.6% | 19 | 27 | -31.6% | 15.4% | 21.6% | -6.1% | 25.4% | 41.6% | May-18 |
| 136 | (23) | Tangerine Confectionery | Taurus Cayman Partnership LP / Blackstone | Private Equity | Own Label | 120 | 139 | -13.5% | 2 | 7 | -72.5% | 1.5% | 4.7% | -3.2% | 2.3% | 8.5% | Dec-17 |
| 137 | (10) | Greenyard Frozen UK Limited | Greenyard Foods NV | Subsidiary of larger group | Own Label | 120 | 114 | 5.3% | 7 | 4 | 73.8% | 5.9% | 3.6% | 2.3% | 8.6% | 4.2% | Mar-18 |
| 138 | New | Chesterfield Poultry | Mr Mohammed Ahmed and Mr Nadeem Iqbal | Family or closely-owned | Own Label | 120 | 75 | 58.6% | 4 | 3 | 46.0% | 3.5% | 3.8% | -0.3% | 24.9% | 18.0% | Jun-18 |
| 139 | (16) | Randall Parker Foods | Randall Parker Food Group Limited | Family or closely-owned | Own Label | 119 | 123 | -2.9% | (0) | 1 | N/A | -0.2% | 1.1% | -1.3% | -1.5% | 8.8% | Sep-18 |
| 140 | (10) | Kanes Foods | KF Investments Ltd | Family or closely-owned | Own Label | 115 | 108 | 5.8% | (12) | (9) | N/A | -10.7% | -8.4% | -2.4% | -27.5% | -14.6% | Mar-18 |
| 141 | New | Dairygold Food Ingredients | Dairygold Co-operative | Subsidiary of larger group | Own Label | 113 | 84 | 34.1% | 2 | 1 | 35.9% | 1.6% | 1.6% | 0.0% | 4.6% | 4.2% | Dec-17 |
| 142 | (18) | Farne Salmon & Trout | Labeyrie | Subsidiary of larger group | Own Label | 113 | 117 | -4.0% | 1 | 4 | -76.8% | 0.9% | 3.7% | -2.8% | 5.2% | 24.3% | Jun-18 |
| 143 | (29) | Lyons Seafoods | Labeyrie Fine Foods SAS | Subsidiary of larger group | Own Label | 112 | 136 | -17.2% | 4 | 8 | -49.0% | 3.7% | 6.0% | -2.3% | 9.2% | 19.6% | Jun-18 |
| 144 | New | Harvey & Brockless | BFP 2015 | Family or closely-owned | Brand | 111 | 100 | 11.3% | 1 | 2 | -37.3% | 1.3% | 2.3% | -1.0% | 20.9% | 57.7% | Sep-18 |
| 145 | (7) | Highland Spring | Park Tower Holdings Establishment | Family or closely-owned | Brand | 110 | 100 | 10.4% | 4 | 6 | -24.9% | 3.9% | 5.7% | -1.8% | 10.4% | 18.0% | Dec-17 |
| 146 | (13) | Green Label Foods | Green Label Foods Limited | Family or closely-owned | Brand | 109 | 107 | 2.5% | 6 | 3 | 107.9% | 5.2% | 2.5% | 2.6% | 16.4% | 11.0% | Feb-18 |
| 147 | (8) | Blue Skies | J C Pile and A J D Pile, | Family or closely-owned | Own Label | 109 | 99 | 10.0% | 5 | 2 | 189.3% | 4.6% | 1.7% | 2.8% | 21.1% | 8.3% | Dec-18 |
| 148 | (16) | Vitacress Ltd | SIEL SGPS SA | Subsidiary of larger group | Own Label | 108 | 110 | -1.9% | 2 | 1 | 249.7% | 2.1% | 0.6% | 1.5% | 3.6% | 1.0% | Dec-17 |
| 149 | (15) | Mizkan | Mizkan Euro Ltd. | Subsidiary of larger group | Own Label | 108 | 104 | 3.2% | (4) | 3 | N/A | -3.3% | 2.6% | -6.0% | -6.2% | 4.6% | Feb-18 |
| 150 | (6) | Signature Flatbreads UK Ltd. | Bakery Investments | Family or closely-owned | Own Label | 105 | 91 | 15.4% | 9 | 6 | 53.9% | 8.8% | 6.6% | 2.2% | 23.3% | 15.4% | Jul-18 |
Methodology: The Top 150 Food & Drink Suppliers survey is produced by OC&C, a consultancy offering strategic advice to top management on the most complex issues in fmcg. In some cases (eg PepsiCo) it has not been possible to provide fully consolidated group accounts. Some companies include returns from international (eg ABF, Hilton Food Group)and non-food (eg Unilever) operations where it was not possible to separate based on accounts.
Ownership: Listed (publicly listed), PE (private equity), Sub (subsidiary of a larger group), Family (family/closely owned).
Main activity: B (branded), O/L (own label).
Notes: 17 Tulip: part of Danish Crown but results not consolidated in Danish Crown UK accounts; 27 Woodhead Bros: trading as Neerock; 55 Innocent: trading as Fresh Trading; 99 Haribo: trading as Dunhills.
Contact: to find out more about the Top 150 study contact OC&C on 020 7010 8000 or visit occstrategy.com
How is food & drink M&A holding up in 2019?
The M&A market for food and drink in 2018 featured strong deal volumes for transactions involving the Top 150 – but the ongoing uncertainty looks to be hampering acquisitions so far in 2019.
There were 18 deals in 2018 for UK domiciled targets over £20m – a sharp rise from just seven such deals in 2017 and five in 2016 – including the £6.2bn Unilever sale of its spreads business to Upfield/KKR.
So far 2019 has seen just one £1bn-plus deal – Saputo’s acquisition of Dairy Crest – and Shaun Browne at Houlihan Lokey has witnessed “examples of vendors deciding not to sell because they are not able to achieve the valuations they once could,” while the £150m sale of Graze to Unilever came in a lot lower than its original £300m estimate.
Valuation multiples for listed UK food companies began to slide at the end of 2017 and though “good assets will still sell for good multiples,” Damian Thornton at Stamford Partners adds, “disparity between buyer and seller price expectations has seen a number of assets fail to sell at all”.
The current year has seen only one European buyer come in for a UK asset (Ireland’s Valeo Foods’ £56m acquisition of Kettle earlier this month), with acquirers from North America (including Canada’s Saputo) most active.
“We’ve seen a step-up of North American buyers and a real drop-off of interest from the EU,” says OC&C’s Will Hayllar. “While currency devaluation has been most significant against the dollar, I also think North America they don’t have quite the same negative emotional perspective about Brexit.”
Browne argues the perceived value of assets is a red herring, however. Despite the headline price of UK businesses falling, their resultant profit contribution will also be reduced by currency translation. “The weaker pound does imply a lower valuation, but not necessarily a lower valuation multiple,” he says.
Instead, the durable demand for UK food and drink assets is reflective of the fundamental strength of the sector. “UK assets remain incredibly attractive for buyers from outside the UK because of the fundamental technological standards and food quality associated with the sector,” says Stamford Partners’ Damian Thornton.
Despite closing in on the latest Brexit deadline, there have been some notable deals over the summer, including the £2.7bn sale of brewer and pubco Greene King to a company controlled by Hong Kong billionaire Li Ka-shing, the £290m sale of Danish Crown’s Tulip business to Pilgrim’s Pride, the US-listed arm of Brazilian giant JBS, the £280m Tilda sale to Spain’s Ebro Foods, and Greencore’s £56m investment in Freshtime.
OC&C 150: top performers
McCain Foods
Turnover growth: 9.7%
Operating margin: 11.3%
The frozen chips and vegetables producer experienced a buoyant year in 2018 as a switch towards premiumisation and healthier product lines drove sales up to £512m, offsetting a 1.3% volume decline concentrated in its core chips range. McCain expanded its offering with the addition of triple-cooked gastro chips, while jumping on the health trend to unveil a lighter home chips range with 30% less fat.
Coca-Cola European Partners
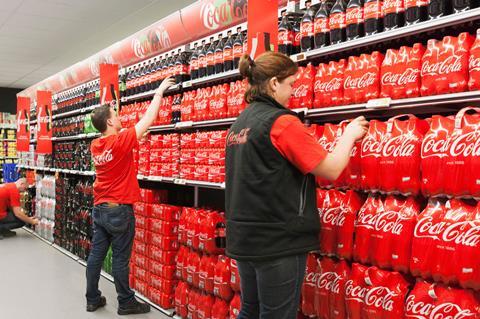
Turnover growth: 12.7%
Operating margin: 14.7%
CCEP’s stellar year was boosted by unseasonably warm weather, a royal wedding and the Fifa World Cup. But the drinks giant’s double-digit sales growth was also down to gaining retail space and diversification of its portfolio, shifting to non-Coca-Cola products including energy drinks. It has also introduced higher-value formats, with 30% growth from small cans and 7% from glass in the third quarter.
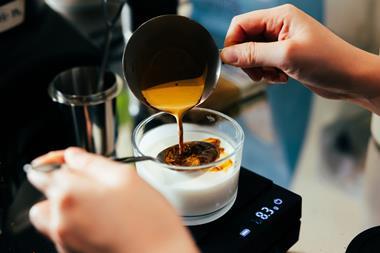
Finlays

Turnover growth: 10%
Operating margin: 7.4%
Strong focus on consumer trends helped Finlays achieve 10% sales growth in 2018. The tea and coffee supplier gained a market-leading position in the production and supply of coffee extract solutions, including cold brew and iced coffee, riding the wave of strong consumer growth in the category. Furthermore, Finlays boosted margins by selling off non-core businesses, including its horticulture division.
Scottish Sea Farms
Turnover growth: 29.9%
Operating margin: 31.4%
Salmon producer Scottish Sea Farms benefited from strong growth in UK demand for premium Scottish salmon, which boosted sales by 30% in 2018 to reach £200m. Multiple infrastructure investments on its existing 40 farms also helped the company increase output and capability. The company was able to build close business relationships with major retailers including Marks & Spencer, Waitrose and Tesco.
Nichols
Turnover growth: 7.0%
Operating margin: 22.4%
The listed soft drinks player’s growth was driven by a strong performance of Vimto, particularly its healthier no-added-sugar and Remix variants as customers continue to shift to healthier options. The hot summer weather and new business wins with Asda and Morrisons also helped, while it increased its presence in the out-of-home category after winning a seven-year contract to supply frozen beverages to Cineworld.
International sales growth
A significant silver lining among the margin pressures caused by the falling pound is the improved relative value of UK products and the opportunity to step up exports.
The export opportunity is one UK producers have looked to take advantage of, with international sales growth of 5.6% again ahead of domestic sales growth of 3.6%.
The top 150’s total share of revenue drawn from outside the UK grew from 17.6% in 2017 to 17.9% last year.
However, international sales growth is down from a bumper 14.1% in 2017 as the tailwind from the weak pound has dissipated. In 2017 the falling pound was worth around 6% growth, compared with just 1% last year.
Nevertheless, that still translated to an approximate halving of export growth at constant currency of 8% in 2017, compared with 4% last year.
OC&C’s Will Hayllar suggests that the threat of no-deal, and the resultant tariff concerns and disruptions to trade flow, could have had some effect this year on the efforts of UK businesses to drive export sales – particularly sales into the EU.
However, “the underlying trend for export growth was happening prior to any mention of Brexit,” notes Hayllar, with international sales increasingly important since 2011/12, when growth stalled completely in conventional UK supermarket channels.
“The devaluation after the referendum helped accelerate some of that growth and reinforced that existing motivation to grow into new markets,” adds Hayllar.
Liberum’s Robert Waldschmidt agrees: “Any business which reaches a certain size is going to look at growth outside its home market. And global growth stories are always going to be sexy and attract investment in both private and public companies.”
Of those top 150 companies that split out international sales, 59 grew exports last year as a proportion of total sales, with 30 decreasing their shares of international revenue.
Four top 150 companies – Baxters Food Group, Associated British Foods, Innocent Drinks (trading as Fresh Trading) and The Scottish Salmon Company – draw half or more of their total revenues from non-UK markets.
Many of those companies that grew exports by the largest proportion in 2018 already had a strong international presence or were part of wider groups.
Scottish veg producer Kettle Produce, which has operations in Spain, grew international revenues as a proportion of overall growth by 229%, while Young’s Seafood and McCain Foods GB grew their export contribution by 146% and 132% respectively.

No comments yet