


Ah, 2017: what a year! We had Tesco-Booker, the gin craze, tabloid panic about burnt toast, “absolutely rank” reformulated Lucozade, and plain ciggie packets.
And shrinkflation; a veritable epidemic of shrinkflation across grocery.
Haribo, Frijj, Stella Cidre, Gü Puds, Peperami, Doritos and Richmond sausages were among the brands found to have slashed pack sizes without cutting prices. And they weren’t the only ones getting smaller. It turns out 144 food and drink products shrank between September 2015 and June 2017, according to a new ONS report.
Bread, cereal, meat, sugar, spreads and confectionery were the leading culprits, with 86 shrinkages between them, the ONS reveals, and ‘prices tended not to move when products changed size, consistent with the idea that some products are undergoing ‘shrinkflation’’.
Given the timescales of the data, it’s perhaps unsurprising that the national media has seized on the figures as evidence that manufacturers and retailers are using ‘stealth tactics’ to reclaim rising costs in the wake of the 2016 Brexit vote.
Read more: Shrinkflation ‘endemic’ in food and drink, warns report
Indeed, in those halcyon days of 2017, currency pressures were often cited by suppliers as the reason for smaller SKUs. Haribo, for instance, blamed the cost of raw materials, unfavourable exchange rates, and investment in infrastructure, new jobs and R&D for its pack size reductions, while Peperami said it had been subject to “rising commodity costs and foreign exchange pressure” due to “significant currency fluctuations”.
It was easy to empathise: sterling took a very nasty tumble in the wake of the EU referendum result – falling to a 31-year low – and it’s been limping ever since.
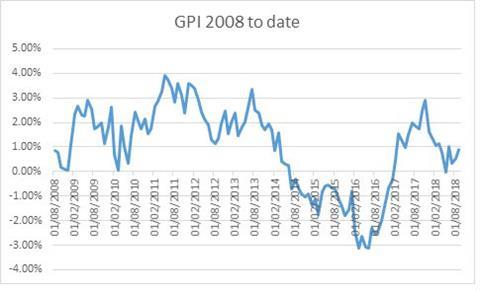
But shrinkflation isn’t just about Brexit. According to the ONS, this is a long-term trend, not a recent phenomenon, and there was no significant uplift in cases directly after the 2016 EU referendum.
‘Manufacturers’ costs may also be rising because of the recent fall in the value of the pound – leading some commentators to attribute shrinkflation to the UK’s decision to leave the European Union. But our analysis doesn’t show a noticeable change following the referendum that would point towards a Brexit effect,’ it says.
And while the ONS report (which identifies no brands by name) posits no other reasons for shrinkflation, it’s important to recognise that cost pressures aren’t the only driver. Demand for convenient on-the-go formats and pressure from government and health campaigners to reduce portion sizes are significant influences, too. (Remember how Kellogg’s was accused of shrinkflation in April 2017 when Coco Pops got lighter following a cut in sugar?)
So, while shrinkflation is very front of mind once again, and will no doubt be employed by brands and retailers if the pound comes under further pressure, it’s worth remembering there are many big reasons for smaller packs.
Analysis of the Grocer Price Index, collated by Edge by Ascential from around 60,000 SKUs across the big four supermarkets, shows just how little price inflation has occurred over recent years.
Despite post-Brexit annual inflation peaking at 2.9% in December 2017, headline prices are almost unmoved on a longer 5-year basis given the period of heavy deflation between 2014 and 2016.
As such, prices are only up 0.7% over five years, compared to the 10.9% supermarket prices rose in the prior five year period.
Notably prices are down over that period in key staple categories such as bakery (down 1.1% over five years), fruit and veg (down 0.2%), meat, fish and poultry (down 6.2%) and dairy (down 0.5%).
| Dec-13 | Dec-18 | Inflation% | |
|---|---|---|---|
|
Average (Gpi) |
110.8924 |
111.6585 |
0.69% |
|
Grocer Baby |
108.1619 |
116.8626 |
8.04% |
|
Grocer Bakery |
110.3677 |
109.1465 |
-1.11% |
|
Grocer Biscuits, Confectionery, Snacks |
115.7914 |
117.2219 |
1.24% |
|
Grocer Chilled |
106.2667 |
111.7889 |
5.20% |
|
Grocer Dairy |
113.2544 |
112.7277 |
-0.47% |
|
Grocer Deli |
112.4901 |
97.21925 |
-13.58% |
|
Grocer Dry Grocery |
115.1265 |
119.1265 |
3.47% |
|
Grocer Frozen |
105.3552 |
105.4987 |
0.14% |
|
Grocer Fruit And Veg |
112.3283 |
112.0735 |
-0.23% |
|
Grocer Health And Beauty |
101.3707 |
101.7539 |
0.38% |
|
Grocer Household |
106.3075 |
103.2938 |
-2.83% |
|
Grocer Liquor |
109.8203 |
110.9336 |
1.01% |
|
Grocer Meat, Fish And Poultry |
114.4625 |
107.3838 |
-6.18% |
|
Grocer Soft Drinks |
111.9074 |
109.0401 |
-2.56% |
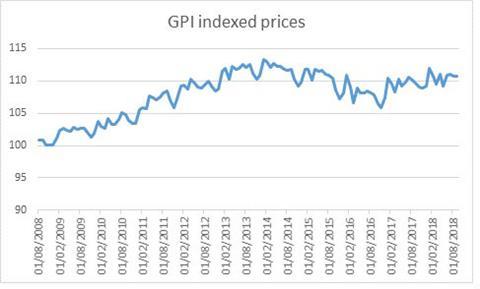
Supermarket prices still remain under the absolute peak hit in early 2014.
The data suggests that under pressure suppliers and retailers have been reluctant to push through heavy price increases in recent times despite mounting costs because of the intense level of competition in the sector. Instead ‘shrinkflation’ has been employed as a response to recover margin where price rises would have previously been the routine course of action.
Given consumers are still paying less for their food than they were five years ago, it is difficult to see customers as particular losers from shrinkflation.
The whole history of GPI going back to 2008 to show how much consumers benefitted from the price war since 2014 – in addition to weaker commodity/oil prices.
On an indexed basis, the GPI shows ongoing strong increases in headline prices until 2014, where inflation fell away from the market and prices have largely flat-lined since that date.


No comments yet